Introduction
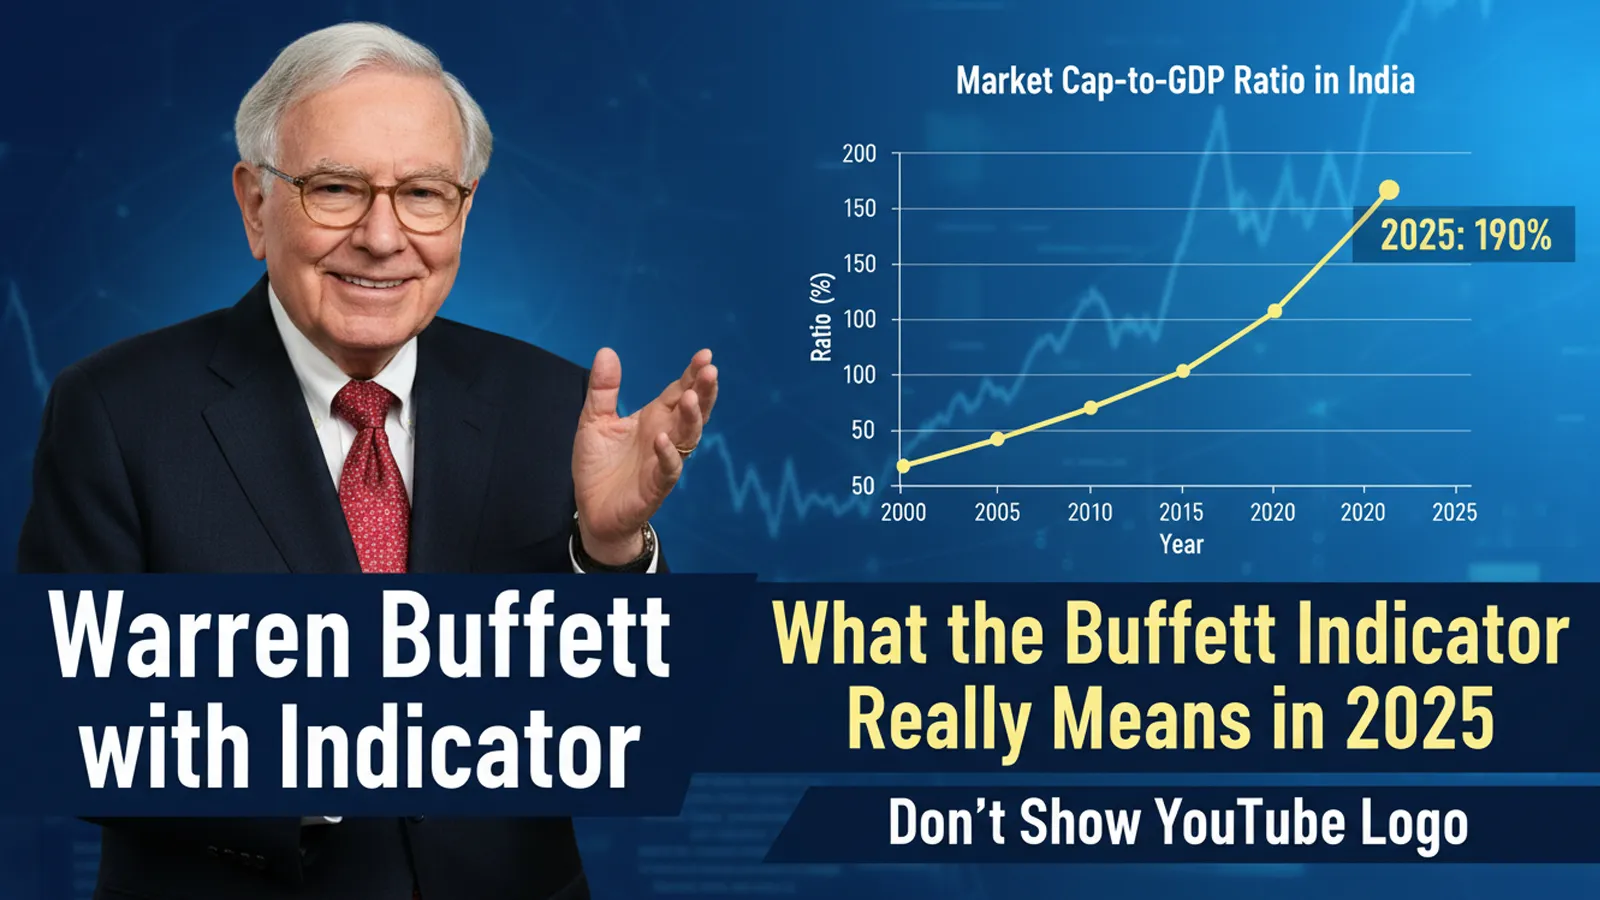
When Warren Buffett casually remarked that the market cap-to-GDP ratio was “the single best measure of where valuations stand,” he probably didn’t imagine founders and CFOs in India quoting it years later. Yet here we are.
The idea is simple enough. Compare the value of a country’s listed companies with the size of its economy. If markets are running too far ahead, the ratio tells you. If they are lagging, it tells you that too.
Over the last decade, this number has become part of India’s market vocabulary. Especially after 2020, when valuations soared, IPOs flooded the pipeline, and retail investors jumped in like never before. By 2025, the Buffett Indicator isn’t just a talking point. It’s a question founders get from investors all the time: are Indian equities priced too high?
How India’s Ratio Has Shifted
Go back a bit and you’ll see the swings:
- Between 2010 and 2016, before GST and demonetisation, the ratio stayed between 60 and 80 percent.
- After reforms like GST, IBC, and RERA in 2017, optimism pushed it near 100.
- Then the pandemic hit. Markets crashed, and the ratio fell with them.
- The recovery that followed was anything but gentle. From 2021 to 2024, IPOs set records, PE money flowed in, and lakhs of new investors piled into equities. The ratio touched 120 and above.
- Today in 2025, it still hovers above 110.
In plain English, Indian markets are not cheap.
Why Promoters Should Pay Attention
The indicator isn’t just trivia. It shapes behaviour.
When the number is high, investors bargain harder. Bankers preparing IPOs tread more carefully. Global funds compare India to other emerging markets and ask if they are overpaying.
For SMEs, the consequences are sharper. Ask too much in a high-ratio market and credibility slips. Structure deals with discipline, and you stand out.
The Flaws Everyone Forgets
Now, to be fair, the Buffett Indicator isn’t perfect, especially in India.
- A massive part of our economy is informal and invisible in listed company values.
- A few sectors, tech and finance mainly, dominate market cap but not GDP.
- GDP itself grows quickly, which can normalise the ratio over time.
- And foreign inflows can inflate or deflate valuations without any link to fundamentals.
So treat it as a weather forecast, not a balance sheet. Useful, yes. Absolute, no.
A Case From 2021
A consumer-tech startup went public when the ratio was near 130 percent. On paper, it looked risky. Investors worried the market was frothy.
Our role at Mantraa was to bring the conversation back to fundamentals. We stress-tested numbers, reframed the IPO story around predictable revenue, and used global benchmarks instead of local hype.
The IPO got oversubscribed. The lesson? In hot markets, governance and financial clarity win more trust than just momentum.
How CFOs Should Use the Indicator
Think of it as background music. Loud, sometimes distracting, but not the main song.
- If the ratio is high, double down on showing revenue quality and governance.
- Don’t dodge the topic. Acknowledge it, then defend your numbers.
- Blend fundraising sources. Equity alone may not be wise in overheated markets.
- Be cautious on acquisitions. High ratios mean expensive deals, so diligence is non- negotiable.
What Founders Should Remember
The Buffett Indicator is a barometer, not a compass. It tells you the pressure, not the path.
High readings don’t mean you stop raising or listing. They mean you raise smarter. Stronger governance stories, cleaner reconciliations, and realistic valuations are what separate successful fundraises from failed ones.
Conclusion
In 2025, India’s Buffett Indicator points to optimism, but also a market that isn’t cheap. For promoters and CFOs, the real takeaway is not to obsess over the ratio itself, but to prepare stories and numbers that stand even if the market cools.
Because investors don’t really buy into ratios. They buy into credibility, and credibility always trades at a premium.
